 US9180183, Quinidine BDBM190405
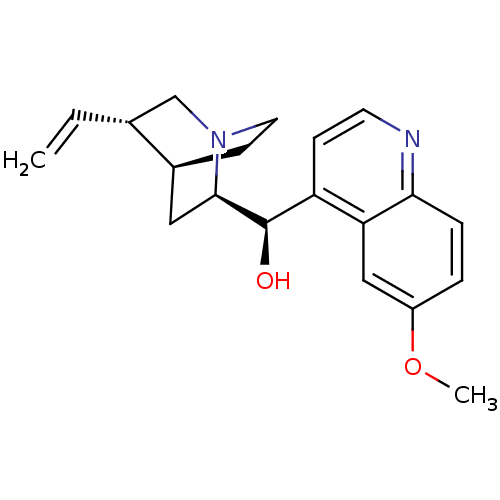 QUININE SULFATE BDBM50198085 Quinidine CHEMBL436523
 CIN-QUIN BDBM50410855 QUINIDEX QUINIDINE SULFATE
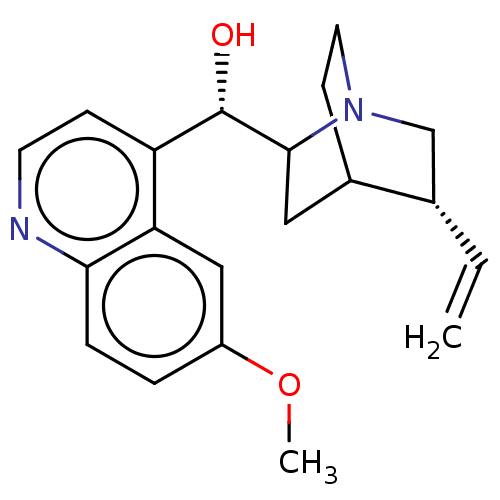
 BDBM50121975 DURAQUIN CIN-QUIN QUINAGLUTE QUINATIME QUINACT QUINIDEX QUINIDINE CARDIOQUIN QUINALAN US9402878, Quinidine (6-Methoxy-quinolin-4-yl)-(5-vinyl-1-aza-bicyclo[2.2.2]oct-2-yl)-methanol QUINORA CHEMBL1294
 (S)-(6-methoxy-quinolin-4-yl)-((2R,5S)-5-vinyl-1-aza-bicyclo[2.2.2]oct-2-yl)-methanol CIN-QUIN (6-Methoxy-quinolin-4-yl)-(5-vinyl-1-aza-bicyclo[2.2.2]oct-2-yl)-methanol; compound with sulfuric acid Cardioquin (6-Methoxy-quinolin-4-yl)-(5-vinyl-1-aza-bicyclo[2.2.2]oct-2-yl)-methanol; sulphate QUINIDINE BDBM50017681 (S)-(6-Methoxy-quinolin-4-yl)-((2R,4S,5S)-5-vinyl-1-aza-bicyclo[2.2.2]oct-2-yl)-methanol (quinidine)(6-Methoxy-quinolin-4-yl)-(5-vinyl-1-aza-bicyclo[2.2.2]oct-2-yl)-methanol Quinidex (S)-(6-Methoxy-quinolin-4-yl)-((2R,5R)-5-vinyl-1-aza-bicyclo[2.2.2]oct-2-yl)-methanol (S)-(6-methoxyquinolin-4-yl)[(2R,4S,5R)-5-vinyl-1-azabicyclo[2.2.2]oct-2-yl]methanol (6-Methoxy-quinolin-4-yl)-(5-vinyl-1-aza-bicyclo[2.2.2]oct-2-yl)-methanol (S)-(6-Methoxy-quinolin-4-yl)-((2R,4S,5R)-5-vinyl-1-aza-bicyclo[2.2.2]oct-2-yl)-methanol 6-methoxy-4-quinolyl-5-vinyl-1-azabicyclo[2.2.2]oct-2-yl-S-methanol (S)-(6-methoxyquinolin-4-yl)((2R,4S,5R)-5-vinylquinuclidin-2-yl)methanol 8R,9S(6-Methoxy-quinolin-4-yl)-(5-vinyl-1-aza-bicyclo[2.2.2]oct-2-yl)-methanol Quinalan Quinatime (S)-(6-methoxyquinolin-4-yl)((2R,5R)-5-vinylquinuclidin-2-yl)methanol TCMDC-131239 Quinine Quinora (S)-(6-Methoxy-quinolin-4-yl)-(5-vinyl-1-aza-bicyclo[2.2.2]oct-2-yl)-methanol Quinact Duraquin (1S,2R,4S,5R)-2-[(S)-Hydroxy-(6-methoxy-quinolin-4-yl)-methyl]-5-vinyl-1-azonia-bicyclo[2.2.2]octane Quinaglute (S)-(6-methoxyquinolin-4-yl)((3S,4R,7R)-3-vinylquinuclidin-7-yl)methanol (6-Methoxy-quinolin-4-yl)-((2S,4S,5R)-5-vinyl-1-aza-bicyclo[2.2.2]oct-2-yl)-methanol CHEMBL97
- ChEMBL_1667568 (CHEMBL4017364) Inhibition of human CYP2D6 using quinidine as substrate
- ChEMBL_2171308 (CHEMBL5056442) Inhibition of CYP2D6 (unknown origin) using quinidine as substrate
- ChEMBL_1582558 (CHEMBL3816820) Inhibition of human P-glycoprotein transfected in pig LLC-GA5-COL150 cells assessed as quinidine transport from apical to basolateral side preincubated for 30 mins followed by quinidine addition to apical side measured after 60 mins
- Inhibition Assay Six test compound concentrations (0.1, 0.25, 1, 2.5, 10, 25 μM in DMSO; final DMSO concentration=0.25%) are incubated with human liver microsomes (0.5 mg/mL) and NADPH (1 mM) in the presence of the probe substrate dextromethorphan (5 μM) for 5 mM at 37� C. The selective CYP2D6 inhibitor, quinidine, is screened alongside the test compounds as a positive control.
- Inhibition of Cytochrome P450 Oxidase The human liver microsomes (0.253 mg/mL protein) containing cytochrome P450, test compounds (0.05-50 μM), CYPs substrates (10 μM p-acetaminophen, 5 μM diclofenac, 30 μM mephenytoin, 5 μM dextromethorphan hydrobromide, 2 μM midazolam), 1.0 mM NADP were incubated at 37� C. for 10 minutes. Naflavone, sulfafenpyrazole, N-3-benzylnivan, quinidine, and ketoconazole were used as reference inhibitors. The results are shown in Table 3. The IC50 of the test compounds are all greater than 50 μM.
- Enzyme Activity Assay Test Example 5: 100 mM PBS buffer was formulated, which was then used to formulate 2.5 mg/ml microsome solution and 5 mM NADPH solution. The 5� concentration of the compound working solution was diluted with PBS gradient (150, 50, 15, 5, 1.5, 0.15, 0.015, 0 μM). The 5� concentration of quinidine working solution was diluted with PBS gradient (150, 50, 15, 5, 1.5, 0.15, 0.015, 0 μM). Dextromethorphan working solution was diluted with PBS to a concentration of 50 μM.20 μl of 2.5 mg/ml microsome solution, 20 μl of 50 μM testosterone working solution, 20 μl of MgCl2 solution and 20 μl of the compound working solution (150, 50, 15, 5, 1.5, 0.15, 0.015, 0 μM, different reaction systems for each concentration) were taken respectively and mixed well. For the positive control group, the compound was replaced with the same concentration of quinidine. The mixture together with 5 mM NADPH solution were pre-incubated at 37� C. for 5 minutes. After 5 minutes, 20 μl of NADPH were added to each well, the reaction was started and incubated for 30 minutes. All the incubated samples were present in duplicate. After 30 minutes, 250 μl of acetonitrile containing internal standard were added to all samples, mixed well, shaken at 800 rpm for 10 minutes, and then centrifuged at 3700 rpm for 10 minutes. 80 μl of the supernatant were taken and analyzed by LC-MS/MS.
- CYP450 Inhibition Assay The ability of the R and S enantiomers of (4-fluorophenyl)(4-((5-methyl-1H-pyrazol-3-yl)amino)quinazolin-2-yl)methanol to inhibit the common drug metabolizing isoforms of cytochrome P450 (CYP) was evaluated against the following isoforms: CYP1A2, CYP2B6, CYP2C8, CYP2C9, CYP2C19, CYP2D6, and CYP3A4. The compounds were incubated in duplicate with eight test compound concentrations (final DMSO concentration of 0.20%) with human liver microsomes (0.25 or 0.50 mg/mL) and NADPH (1 mM) in the presence of CYP isoform specific probe substrates (phenacetin, bupropion, taxol, diclofenac, mephenyloin, dextromethorphan, testosterone) at the Km for 10-20 minutes at 37° C. Selective CYP isoform inhibitors (furafulline, ticlopidine, quercetin, sulfaphenazole, ticlopidine, quinidine, ketoconazole) were screened alongside the test compounds as positive controls.
- Human Cytochrome P450 Inhibition Assay CYP450 enzymes (final protein 75 pmol/mL for CYP1A2; 12.5 pmol/mL for CYP2C19; and 25 pmol/mL for CYP2C9, 2D6, and 3A4), 0.1 M phosphate buffer pH 7.4, probe and test compound (final concentration 50, 15.8, 5, 1.58, 0.5, and 0.158 μM; diluted from 10 mM stock solution to give a final DMSO concentration of 1%) were pre-incubated at 37� C. for 5 minutes. The reaction was initiated by the addition of 20 μL of 10 mM NADPH in phosphate buffer. The final incubation volume was 200 μL. The following control inhibitors were used for each CYP450 inhibition assay: CYP1A2: α-naphthoflavone; CYP2C9: sulfaphenazole; CYP2C19: tranylcypromine; CYP2D6: quinidine; CYP3A4: ketoconazole.
- In-Vitro Safety Profile-Testing the Selectivity Over hErg Inhibition of the ion channel hErg (or Kv11.1) current causes QT interval prolongation resulting in potentially fatal ventricular tachyarrhythmia called Torsade de Pointes. This is one of the major causes of cardiotoxicity and hErg channel activity is usually evaluated early in the drug development process to mitigate cardiotoxicity risk.hERG ion channel activity was assessed using a patch clamp technique in stable Kv11.1 (hERG) transfected human embryonic kidney cell line (HEK293). Whole cell recordings were carried out with an automated patch clamp device Patchliner™ from Nanion Technologies, Munich following manufacturer recommendation. Different concentrations of the test compound or reference, quinidine, were applied to whole cells suspension and current was measured using a pulse pattern with fixed amplitudes. The effect on Kv11.1 (hERG) ion channel activity was judged from the tail current amplitude and Changes in Kv11.1 (hERG) ion channel activity between control value (defined as 100%) and test compound and reported as percent change of control value of COI.
- Drug-Drug Interaction (DDI) Assay The assay was set up and executed using a Biomek FXp robotic liquid handling workstation (Beckman Coulter Corp., Fullerton, Calif.), integrated with a Cytomat shaking incubator set at 37� C. (Thermo Electron Corp., Bellefonte, Pa.). A batch of human liver microsomes from 50 donors, pooled and characterized by BD Gentest, (Cat #457111, lot 01220, 20 mg/mL in 250 mM sucrose) was used. Each substrate was incubated at a protein concentration of 0.1, 0.15 or 0.2 mg/mL in a total incubation volume of 0.16 mL. The incubates were prepared in 100 mM potassium phosphate buffer (pH 7.4) supplemented with 5 mM magnesium chloride and 1 mM EDTA. Quinidine was used as a positive control inhibitor for CYP2D6. Quinidine was prepared as a working solution in organic solvent (primarily methanol, with DMSO and acetonitrile as secondary solvents) and was spiked into the microsomal suspension to yield the desired concentration level. The solution was then serially diluted with additional microsomal suspension to yield eight concentration levels. Final organic content was less than 0.07%. A stock solution of the test compound was prepared at a concentration of 50 mM or higher, if possible, in an adequate organic solvent (DMSO, methanol or acetonitrile), depending on solubility limitations. The stock solution was serially diluted with methanol and subsequently spiked into the microsomal suspension to yield final incubation concentrations of 0, 0.1, 0.3, 1, 3, 10, 30 and 100 μM for Comparator Compound and 0, 0.06, 0.18, 0.6, 1.8, 6, 18 and 60 μM for 4-(2,2-difluoro-benzo[1,3]dioxol-5-ylmethyl)-piperazine-1-carboxylic acid (4-chloro-pyridin-3-yl)-amide. The final organic content was 0.2%. Incubations were performed in triplicate for each probe substrate. The control inhibitor (quinidine) and marker substrate (dextromethorphan or bufuralol) were transferred to the incubation vessels (60 μL aliquots each). After a pre-incubation period at 37� C., the reactions were initiated by the addition of a 40 μL aliquot of NADPH regenerating system (BD Gentest). A 40 μL aliquot (diluted 6:19 with incubation buffer) provided final concentrations of 1.3 mM NADP+, 3.3 mM glucose-6-phosphate and 0.4 U/mL glucose-6-phosphate dehydrogenase. Incubation times were 12 minutes for both dextromethorphan and bufuralol. Reactions were terminated by the direct addition of acetonitrile (160 μL) to the incubation mix followed by transfer to a pooling plate containing additional acetonitrile (400 μL). The incubation reactions were pooled by equal test compound or control inhibitor concentration, transferred to a Phenomenex Strata Impact protein precipitation filter plate containing acetonitrile and internal standards (100 μL of a mixture of the following deuterated compounds ranging in concentration from 0.5 to 2.8 μM: hydroxybufuralol-d9, dextrorphan-d3). The resulting filtrate was evaporated to dryness under a nitrogen flow, then reconstituted in 250 μL mobile phase (1:1 methanol:water, containing 0.1% acetic acid). Samples and standards were analyzed on a Sciex API4000 triple quadrupole mass spectrometer. The data were acquired in Analyst 1.4.1 (Applied Biosystems/MDS Sciex).
- Enzymatic Activity Assay I. Test Materials and Instruments1. Human liver microsomes (Corning 452117)2. NADPH (Solarbio 705Y021)3. Positive substrates diclofenac (Sigma SLBV3438), dextromethorphan (TRC 3-EDO-175-1) and midazolam (Cerilliant FE01161704)4. Positive inhibitors sulfaphenazole (D. Ehrenstorfer GmbH 109012), quinidine (TCI WEODL-RE) and ketoconazole (Sigma 100M1091V)5. AB Sciex Triple Quad 5500 liquid chromatography-mass spectrometryII. Test Steps: 1. Preparation of 100 mM phosphate buffered saline (PBS): 7.098 g of Na2HPO4 was weighed, 500 mL of pure water was added and subjected to ultrasonic dissolution to obtain solution A. 3.400 g of KH2PO4 was weighed, 250 mL of pure water was added and subjected to ultrasonic dissolution to obtain solution B. Solution A was placed on a stirrer and solution B was slowly added until pH reaches 7.4 to prepare 100 mM PBS buffer. 2. Preparation of 10 mM NADPH solution with 100 mM PBS buffer. 10 mM stock solution of compounds of the invention was diluted with DMSO to obtain a 200� concentration of compound working solution (6000, 2000, 600, 200, 60, 20, 0 �M). The stock solution of positive inhibitors was diluted with DMSO to obtain a 200� concentration of positive inhibitor working solution (sulfaphenazole, 1000, 300, 100, 30, 10, 3, 0 �M; quinidine/ketoconazole, 100, 30, 10, 3, 1, 0.3, 0 �M). A 200 � concentration of substrate working solution (120 �M of diclofenac, 400 �M of dextromethorphan, and 200 �M of midazolam) was prepared in water, acetonitrile, or acetonitrile/methanol. 3. 2 �l of 20 mg/ml liver microsome solution, 1 �l of substrate working solution, 1 �l of compound working solution and 176 �l of PBS buffer were taken, mixed uniformly, and pre-incubated in a 37� C. water bath for 15 minutes. To the positive control group was added 1 �l of diclofenac, dextromethorphan or midazolam working solution to replace the compound working solution. Simultaneously, 10 mM of NADPH solution was pre-incubated together in a 37� C. water bath for 15 minutes. After 15 minutes, 20 �l of NADPH was added to each well to initiate the reaction, and the reaction was incubated at 37� C. for 5 minutes (CYP2C9) or 20 minutes (CYP2D6). Double samples were set for all incubation samples. After incubation for corresponding time, the reaction was terminated by adding 400 ul of ice methanol containing an internal standard to all samples. The mixture was mixed uniformly by vortex and centrifuged at 3220 g at 4� C. for 40 minutes. After centrifugation, 100 �L of the supernatant was transferred to a loading plate, and 100 �L of ultrapure water was added and mixed uniformly for LC-MS/MS analysis.
- Kv11.1 (hERG) ION CHANNEL ACTIVITY (Patch Clamp Assay) Method for the detection and characterisation of test substances which interfere with the Kv11.1 (hERG) channel: Kv11.1 (hERG, human ether a-go-go related gene) is a potassium channel which plays a central role for repolarisation of the cells in the ventricular cardiomyocytes.The patch-clamp measurement was carried out at room temperature in whole-cell configuration on human embryonic kidney cells (HEK293) which have been transfected in a stable manner with the hERG gene.The whole-cell configurations were carried out using an automated patch clamp device (Patchliner, Nanion Technologies, Munich). This is a glass chip-based system with which automated whole-cell measurements on up to 8 cells simultaneously are possible. The glass chip has a hole of defined size to which the cell is transferred into the Gigaseal by application of a reduced pressure and brought into the whole-cell configuration. Buffer, cell suspension and test substances were added to microchannels of the chip using a Teflon-coated pipette. The cells were clamped to a holding potential of −80 mV. For measurement of substancepromoted inhibition of the Kv11.1 channel, the following voltage protocol was applied at 10-second intervals: 51 ms/−80 mV, 500 ms/+40 mV, 500 ms/−40 mV, 200 ms/−80 mV. The leakage current is subtracted by means of the P4 method. The cells were resuspended in extracellular buffer (EC) and applied to the chip. After the cell had been collected, the seal was improved by addition of a seal enhancer buffer. As soon as the whole-cell configuration had been reached, the seal enhancer buffer was washed out and replaced by extracellular buffer. The measurement started in EC for 1.5 min. DMSO (vehicle control, 0.1% of DMSO) was then applied, and the control current was recorded for 3 min. The test substance was subsequently added twice in the same concentration, and the potassium current was measured for 3.5 min in each case.If the measurement result of a test substance at an initial concentration of 10 μM was smaller than (−)50% effect (threshold value) (for example (−)60% effect), the test substance was, in order to determine a dose/action relationship, added cumulatively in increasing concentration, where each concentration was measured for 5 min.The reference substance used was the Kv11.1 (hERG) ion channel blocker quinidine. The effects of test substances and quinidine were standardised to the associated vehicle control. The effect on the Kv11.1 (hERG) channel activity was assessed from the potassium current at −40 mV. For the calculation, the current was evaluated for the respective final trace. A test-substance-induced inhibition of the Kv11.1(hERG) channel was standardised to the vehicle control (0.1% of DMSO).During the measurement, an aliquot of the test substance was taken for concentration determination. The sample was measured immediately by HPLC, and the final concentration was determined from a calibration curve.
- Inhibition Assay The CYP2D6 inhibition assays were conducted using Human Liver Microsomes purchased from Invitrogen and designed to screen potential inhibitors of Cytochrome P450 in physiological condition. Initially the following reagents/mixtures were prepared: (i) Assay buffer: 0.1 M Phosphate buffer pH 7.4 (ii) Cofactor: 15 mM stock was prepared in assay buffer. Final concentration in assay 1.5 mM (iii) Substrate 50 mM DMSO stock was prepared for Bufuralol. From this, a 10 mM sub-stock was prepared in MeCN. Further, a working stock solution of 50 μM was prepared in assay buffer. Final concentration in assay 5 μM (iv) Enzyme: 20 mg/mL stock was provided by the manufacturer. Final concentration in assay is 0.25 mg/mL. At the start of the experiment, various concentrations of compound (7 different concs.) or positive control (Quinidine at a single concentration) were prepared in assay buffer. For 1004 of final reaction system, 1.254 of HLM (20 mg/ml), 504 of 2� stock of test compound/reference compound (from each concentration) was added. Subsequently, 104 of substrate (Bufuralol 50 μM) and 104 of Cofactor (NADPH; 15 mM) were added. The volume was increased to 1004 by adding assay buffer. The reaction was then incubated for 10 min at 37� C. After completion of the incubation period, the reaction was terminated by addition of 2004 of chilled MeOH containing internal standard (Propranolol). The samples were than centrifuged and supernatants were analyzed using LCMS/MS. The data normalization was performed with respect to internal standard and % inhibition was calculated with respect to DMSO control.
- Luciferase-Based P450-Glo Assay Five CYP isoforms (0.5 pmol) were tested, namely 1A2, 2C9, 2C19, 2D6 and 3A4 (each isoform was assayed in a separate assay plate). Each assay plate contained several compounds at 2 concentrations (10 uM and 1 uM), with 2 replicates at each concentration or a small number of compounds per plate in dose response by duplicate (50, 16.5, 5.4, 1.8, 0.6, 0.2, 0.066, 0.022, 0.007 uM). In addition, each assay plate contained 8 different concentrations of an isoform-specific inhibitor (Furafylline, Sulfaphenazole, N-3-benzylnirvanol, Quinidine and Ketoconazole as inhibitors of CYP 1A2, 2C9, 2C19, 2D6 and 3A4, respectively), with two replicates at each concentration. The test compounds and the reference inhibitors were tested at a final DMSO concentration of 0.5%. The assay plate included also 8 replicates a vehicle control containing 0.5% DMSO/H2O. The membranes containing the CYPs, test compound and the probe substrate were pre-incubated 10 min at 37°C. in the absence of NADPH, NADPH was then added following incubation for 60 minutes at 37°C., the reaction was terminated by the addition of Luciferin detection reagent. After 20 min incubation at 37°C., the assay plate was read in the Envision 2104 Multilable reader. Values were normalized against the control activity included for each CYP. These values were plotted against the inhibitor concentration and were fitted to a sigmoid dose-response curve by using the model sigmoidal Four-Parameter Logistc inplement for Activity base software.
- Inhibition Assay Briefly, the experiments were performed on an IonWorks™ HT instrument (Molecular Devices Corporation), which automatically performs electrophysiology measurements in 48 single cells simultaneously in a specialised 384-well plate (PatchPlate™). The cells used were Chinese hamster ovary (CHO) cells stably transfected with hERG. A single-cell suspension is prepared in extracellular solution (Dulbecco's phosphate buffered saline with calcium and magnesium pH 7-7.2) and aliquots added automatically to each well of a PatchPlate™. The cells were then positioned over a small hole at the bottom of each well by applying a vacuum beneath the plate to form an electrical seal. The vacuum was applied through a single compartment common to all wells which is filled with intracellular solution (buffered to pH 7.2 with HEPES). The resistance of each seal was measured via a common ground-electrode in the intracellular compartment and individual electrodes placed into each of the upper wells. Electrical access to the cell was achieved by circulating a perforating agent, amphotericin, underneath the PatchPlate™ and then measuring the pre-compound hERG current. An electrode was positioned in the extracellular compartment and a holding potential of −80 mV applied for 15 sec. The hERG channels were then activated by applying a depolarising step to +40 mV for 5 sec and then clamped at −50 mV for 4 sec to elicit the hERG tail current, before returning to −80 mV for 0.3 s. The test compound was then added at various concentrations (0.008, 0.04, 0.2, 1, 5 and 25 μM) to the upper wells of the PatchPlate™. The test compound was left in contact with the cells for 300 sec before recording currents using the same voltage-step protocol as in the pre-compound scan. Quinidine, an established hERG inhibitor, was included as a positive control.
- Recombinant CYP Inhibition Assay Recombinant CYP Inhibition Assay: In a drug discovery program, a rapid screening for cyctochrome P450 (CYP450) inhibitors is a part of the existing standard for avoiding the development of drugs likely to give clinical pharmacokinetic drug-drug interactions and associated toxicities. A microtiter plate-based, direct fluorometric assay for the activities of the principal human drug-metabolizing enzymes, CYP2D6 and CYP3A4 can be used and these assays are rapid and compatible with existing high-throughput assay instrumentation. Fluorometric Enzyme Inhibition Assays: Test compounds were dissolved in 100% organic solvent (CH3CN or DMSO) to make 30 mM stock solutions. Quinidine (CYP2D6 assay, Sigma Aldrich) and ketoconazole (CYP3A4 assay, Sigma Aldrich) ran as positive controls and were dissolved in 100% acetonitrile to make 1 mM stock solutions. A 100 mM potassium phosphate buffer was prepared and adjusted to pH 7.4. The 30 mM stock solution of test and control compounds (1 mM) were further diluted in phosphate buffer (100 mM, pH 7.4) to ensure the final organic solvent content was <0.2% in the reaction. In a separate falcon tube, a 2� enzyme/substrate (E/S) solution was prepared in phosphate buffer. The final concentration of CYP2D6 (Corning) and AMMC was 10 nM and 4 μM, and CYP3A4 (Corning) and BFC was 20 nM and 40 μM, respectively. In a separate falcon tube, a 2� NADPH regenerating system (NRS) was prepared in phosphate buffer. The final concentration for each component in the assay was as follows:CYP2D6 assay=0.008 mM NADPH, 3.3 mM glucose 6-phosphate, 0.4 U of glucose-6-phosphate dehydrogenase/mL CYP3A4 assay=2.45 mM NADPH, 24.7 mM glucose 6-phosphate, 1.25 U of glucose-6-phosphate dehydrogenase/mL.
- Inhibition Assay Incubations were conducted in 96 well microtiter plates based on a method described by BD Biosciences. To the first well in each row, a NADPH regenerating system and test compound was added. In the second well and all remaining wells, NADPH regenerating system and acetonitrile (final concentration of 2%) was added. The final assay concentration of the NADPH regenerating system was 8.2 uM NADP+, 0.41 mM glucose-6-phosphate, 0.41 mM magnesium chloride hexahydrate and 0.4 U/ml glucose-6-phosphate dehydrogenase and 0.01 mg/mL control insect cell membrane protein. The test compound solution was serially diluted 1:3 through the eighth wells.The final concentration of the test compounds were in the range 100 uM to 45.7 nM in the eight rows. Wells 9 and 10 contained no test compound (only NADPH regenerating system and enzyme/substrate mix) and wells 11 and 12 were used as controls for background fluorescence (enzyme and substrate were added after the reaction was terminated). The plate was then pre-incubated at 37° C. for 10 min, and the reaction was initiated by the addition of pre-warmed enzyme/substrate mix. The assay concentration of the enzyme/substrate mix was 100 mM potassium phosphate, pH 7.4, 1.5 pmol recombinant human P450 CYP2D6 and 1.5 uM of the fluorescent substrate 3-[2-(N,N diethyl-N-methylamino)ethyl]-7-methoxy-4-methylcounnarin (AMMC). The assay was conducted in duplicate in a final volume of 200 uL per well. Reactions were terminated after 30 min by addition of a 4:1, acetonitrile:0.5 M Tris base solution. Quinidine was used as positive control, 0.5 uM as highest concentration. Fluorescence per well was measured using a fluorescence plate reader (excitation: 390 nm, emission: 460 nm).
- hERG Inhibition Studies were conducted at Cyprotex Discovery in Cheshire, UK according to the contractor's protocol. The studies were performed on an IonWorks HT instrument (Molecular Devices Corporation), which automatically performs electrophysiology measurements in 48 single cells simultaneously in a specialised 384-well plate (PatchPlate ). The cells used were Chinese hamster ovary (CHO) cells stably transfected with hERG (cell-line obtained from Cytomyx, UK). A single-cell suspension was prepared in extracellular solution (Dulbecco's phosphate buffered saline with calcium and magnesium pH 7-7.2) and aliquots added automatically to each well of a PatchPlate . The cells were then positioned over a small hole at the bottom of each well by applying a vacuum beneath the plate to form an electrical seal. The vacuum was applied through a single compartment common to all wells which was filled with intracellular solution (buffered to pH 7.2 with HEPES). The resistance of each seal was measured via a common ground-electrode in the intracellular compartment and individual electrodes placed into each of the upper wells.Electrical access to the cell was then achieved by circulating a perforating agent, amphotericin, underneath the PatchPlate and then measuring the pre-compound hERG current. An electrode was positioned in the extracellular compartment and a holding potential of −80 mV applied for 15 seconds. The hERG channels were then activated by applying a depolarising step to +40 mV for 5 seconds and then clamped at −50 mV for 4 seconds to elicit the hERG tail current, before returning to −80 mV for 0.3 seconds. Test compound was then added automatically to the upper wells of the PatchPlate from a 96-well microtitre plate containing a range of concentrations of compound TBAP-01. Quinidine, an established hERG inhibitor, was included as an experimental control. TBAP-01 was dissolved in DMSO and assayed at final concentrations ranging from 100 μM to 32 nM in 0.25% DMSO. Buffer containing 0.25% DMSO was included as a negative control. The test compound was left in contact with the cells for 300 seconds before recording currents using the same voltage-step protocol as in the pre-compound scan. Each concentration was tested in 4 replicate wells.